LogoFav data · October 30, 2026
logo colors by country and industry
We measured the colors of 3,796 real company logos from their SVG files. Blue is the most common lead color (28%), then red (21%). 18% of logos use only black, white or grey, and 60% use a single color.
The lead color of 3,796 logos
What stands out
Countries and industries whose logos lead with a color much more (or less) often than the rest of the catalog. These pass the strict test described under How we measured.
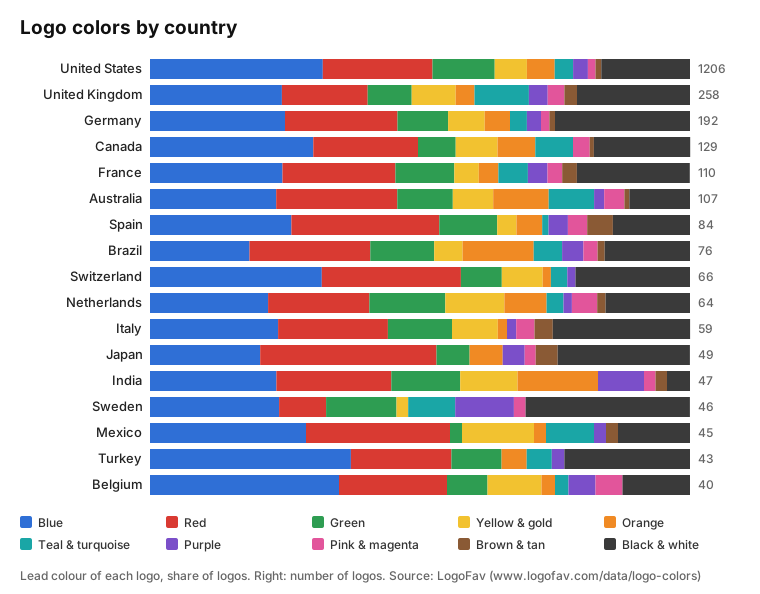
- United Kingdom: 10% of logos lead with teal & turquoise, vs 4% of all other logos (258 logos).
- United States: 32% of logos lead with blue, vs 26% of all other logos (1,206 logos).
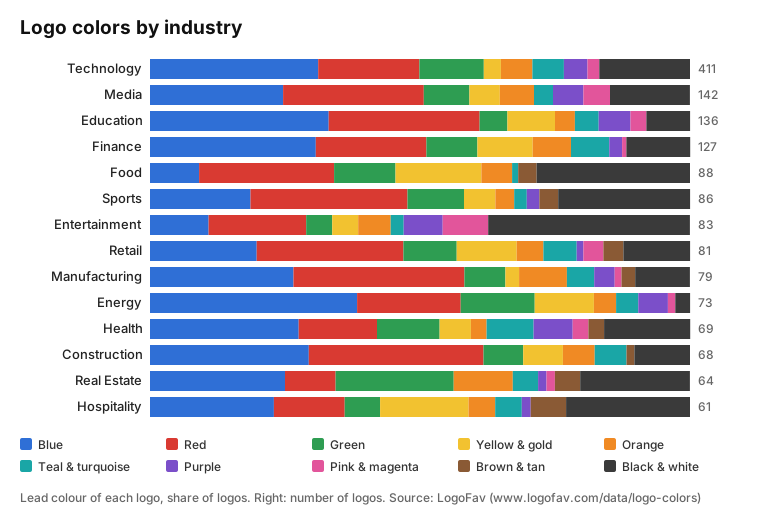
- Entertainment: 37% of logos use only black, white or grey, vs 17% of all other logos (83 logos).
- Entertainment: 8% of logos lead with pink & magenta, vs 2% of all other logos (83 logos).
- Food: 9% of logos lead with blue, vs 28% of all other logos (88 logos).
- Food: 16% of logos lead with yellow & gold, vs 6% of all other logos (88 logos).
Weaker signals, from smaller groups (less than 1 in 100 by chance on its own, but could be chance across this many comparisons):
- Brazil: 13% of logos lead with orange, vs 5% of all other logos (76 logos).
- Sweden: 11% of logos lead with purple, vs 3% of all other logos (46 logos).
- Hospitality: 7% of logos lead with brown & tan, vs 1% of all other logos (61 logos).
Teal & turquoise logos from United Kingdom


Blue logos from United States


Black and white logos from Entertainment


Pink & magenta logos from Entertainment


Logo colors by country
Every country with at least 40 measured logos. Exact shares are in the table below. Free to use with a credit link.
| Country | Logos | Blue | Red | Green | Yellow & gold | Orange | Teal & turquoise | Purple | Pink & magenta | Brown & tan | Black & white |
|---|---|---|---|---|---|---|---|---|---|---|---|
| United States | 1206 | 32% | 20% | 12% | 6% | 5% | 3% | 3% | 1% | 1% | 16% |
| United Kingdom | 258 | 24% | 16% | 8% | 8% | 3% | 10% | 3% | 3% | 2% | 21% |
| Germany | 192 | 25% | 21% | 9% | 7% | 5% | 3% | 3% | 2% | 1% | 25% |
| Canada | 129 | 30% | 19% | 7% | 8% | 7% | 7% | 0% | 3% | 1% | 18% |
| France | 110 | 25% | 21% | 11% | 5% | 4% | 5% | 4% | 3% | 3% | 21% |
| Australia | 107 | 23% | 22% | 10% | 7% | 10% | 8% | 2% | 4% | 1% | 11% |
| Spain | 84 | 26% | 27% | 11% | 4% | 5% | 1% | 4% | 4% | 5% | 14% |
| Brazil | 76 | 18% | 22% | 12% | 5% | 13% | 5% | 4% | 3% | 1% | 16% |
| Switzerland | 66 | 32% | 26% | 8% | 8% | 2% | 3% | 2% | 0% | 0% | 21% |
| Netherlands | 64 | 22% | 19% | 14% | 11% | 8% | 3% | 2% | 5% | 2% | 16% |
| Italy | 59 | 24% | 20% | 12% | 8% | 2% | 0% | 2% | 3% | 3% | 25% |
| Japan | 49 | 20% | 33% | 6% | 0% | 6% | 0% | 4% | 2% | 4% | 24% |
| India | 47 | 23% | 21% | 13% | 11% | 15% | 0% | 9% | 2% | 2% | 4% |
| Sweden | 46 | 24% | 9% | 13% | 2% | 0% | 9% | 11% | 2% | 0% | 30% |
| Mexico | 45 | 29% | 27% | 2% | 13% | 2% | 9% | 2% | 0% | 2% | 13% |
| Turkey | 43 | 37% | 19% | 9% | 0% | 5% | 5% | 2% | 0% | 0% | 23% |
| Belgium | 40 | 35% | 20% | 8% | 10% | 3% | 3% | 5% | 5% | 0% | 13% |
Logo colors by industry
Every industry with at least 60 measured logos. Exact shares are in the table below. Free to use with a credit link.
| Industry | Logos | Blue | Red | Green | Yellow & gold | Orange | Teal & turquoise | Purple | Pink & magenta | Brown & tan | Black & white |
|---|---|---|---|---|---|---|---|---|---|---|---|
| Technology | 411 | 31% | 19% | 12% | 3% | 6% | 6% | 4% | 2% | 0% | 17% |
| Media | 142 | 25% | 26% | 8% | 6% | 6% | 4% | 6% | 5% | 0% | 15% |
| Education | 136 | 33% | 28% | 5% | 9% | 4% | 4% | 6% | 3% | 0% | 8% |
| Finance | 127 | 31% | 20% | 9% | 10% | 7% | 7% | 2% | 1% | 0% | 12% |
| Food | 88 | 9% | 25% | 11% | 16% | 6% | 1% | 0% | 0% | 3% | 28% |
| Sports | 86 | 19% | 29% | 10% | 6% | 3% | 2% | 2% | 0% | 3% | 24% |
| Entertainment | 83 | 11% | 18% | 5% | 5% | 6% | 2% | 7% | 8% | 0% | 37% |
| Retail | 81 | 20% | 27% | 10% | 11% | 5% | 6% | 1% | 4% | 4% | 12% |
| Manufacturing | 79 | 27% | 32% | 8% | 3% | 9% | 5% | 4% | 1% | 3% | 10% |
| Energy | 73 | 38% | 19% | 14% | 11% | 4% | 4% | 5% | 1% | 0% | 3% |
| Health | 69 | 28% | 14% | 12% | 6% | 3% | 9% | 7% | 3% | 3% | 16% |
| Construction | 68 | 29% | 32% | 7% | 7% | 6% | 6% | 0% | 0% | 1% | 10% |
| Real Estate | 64 | 25% | 9% | 22% | 0% | 11% | 5% | 2% | 2% | 5% | 20% |
| Hospitality | 61 | 23% | 13% | 7% | 16% | 5% | 5% | 2% | 0% | 7% | 23% |
How we measured it
LogoFav's catalog holds logos from real companies. For each logo with a clean SVG file (3,796 logos added up to October 30, 2026), we rendered the file and measured how much of the visible logo each color covers. Shades are grouped the way people talk about color: navy and light blue count as blue, gold as yellow, maroon as red. A logo's lead color is the color family that covers the most of it, leaving out black, white and grey, as long as it covers at least 10% of the logo. Logos with no such color count as black & white.
Countries and industries come from each logo's first location and industry tag. A group needs at least 40 logos (countries) or 60 logos (industries) to get its own row. "Stands out" means a two-proportion test against all other logos in the study gave |z| ≥ 2.58 (p < 0.01).
We compared 170 country–color and 140 industry–color pairs, so one or two of the findings at that level could still be chance. These also pass a much stricter test that allows for every comparison (Bonferroni, p < 0.05 overall): United Kingdom teal & turquoise, United States blue, Entertainment black & white, Entertainment pink & magenta, Food fewer blue, Food yellow & gold.
Limits: the catalog is a curated collection, not a random sample of all companies; it leans toward well-known brands and the United States. Colors are measured from the main logo file, so a brand's other versions aren't counted.
Use these numbers
The charts, table and CSV are free to use in articles, posts and talks. Please credit LogoFav with a link to this page.
Cite asLogoFav, "Logo colors by country and industry" (October 30, 2026), https://www.logofav.com/data/logo-colors